Debug view
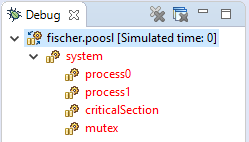
The Debug view is used when debugging a POOSL model. It shows all instances of the model that you are debugging, organized in two groups:
- system: instances from the POOSL model itself
- adapters: instances of external adapters (only if Co-simulation is used)
Instances are colored based on the execution state of that instance. Red means that the instance can do a step, blue means the instance can perform a time step, and black means the instance cannot make any steps.
When selecting a node in the Debug view, the Execution Tree view is updated. When double clicking on a process instance (a leaf of the tree), a process step is performed, which advances the simulation to the next transition of the process, and executes a single next transition.
 The button "Close All Process Windows" at the top of the Debug view closes all open Process windows.
Features for process instances
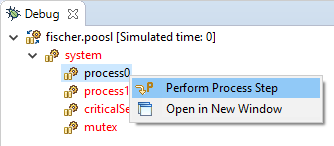
Right click on a process in the debug view to access the following features:
 Perform Process Step
Advance the simulation to a next transition of this process, and execute the transition. (Compare the step buttons.)
 Open in New Window
This option opens a Process window (combination of Execution Tree view and Variables view) to monitor the selected process.
Features for system and cluster instances
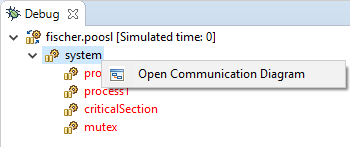
Right click on the system or cluster instance in the debug view to access the following feature:
 Open Communication Diagram
Open the communication diagram of the selected system or cluster instance.