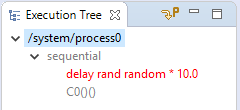
The Execution Tree view is used when debugging a POOSL model. When the simulation is suspended, the local state of the process that is selected in the Debug view is shown in the Execution Tree view. Nodes are colored based on whether they can perform a transition. Red means that the node can do a step, blue means the node can perform a time step, and black means the node is blocked. In addition grey means that sub-statements can be executed, or another statement must first be executed.
When selecting a node in the Execution Tree view, the corresponding statement is highlighted in the editor, and the Variables view is updated. After selecting the top element of the tree, the shortcuts Ctrl+Up and Ctrl+Down can be used to navigate to the next or the previous enabled transition in the tree.
Highlighting does not work when an external adapter instance is selected in the debug view. The first line in the Execution Tree indicates what is selected. When the line starts with adapters an external port instance is selected. When the line starts with system a Poosl instance from the model is selected.
![]() The button Perform Process Step advances the simulation to a next transition of this process, and execute the transition. (Compare the step buttons.)
The button Perform Process Step advances the simulation to a next transition of this process, and execute the transition. (Compare the step buttons.)
To execute a transition from the Execution Tree view, perform one of the steps below: