|
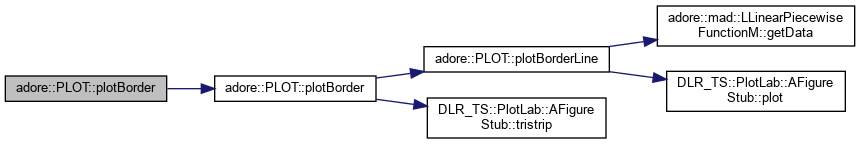
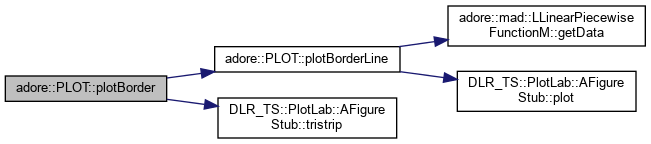
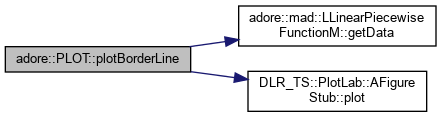
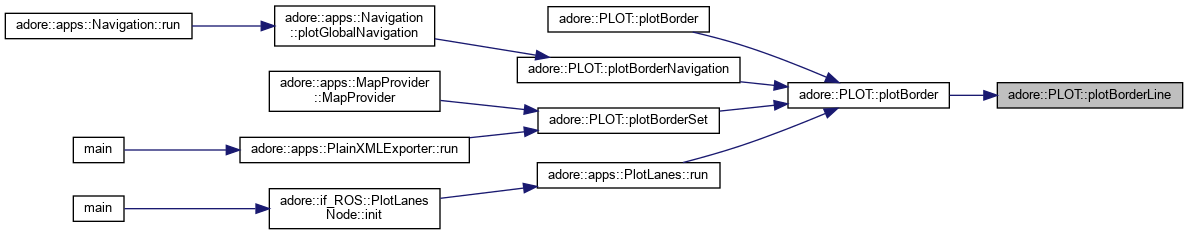
| void | plotBorderLine (std::string name, std::string options, adore::env::BorderBased::Border *b, double z, DLR_TS::PlotLab::AFigureStub *figure) |
| |
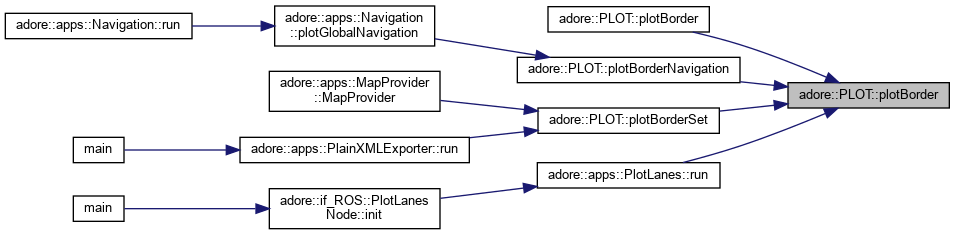
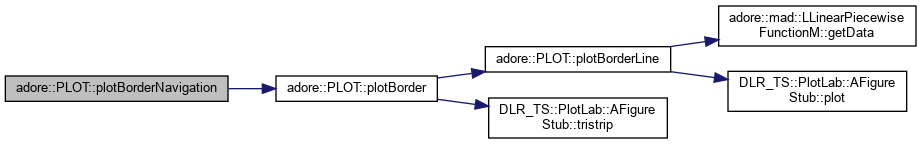
| void | plotBorder (std::string name, adore::env::BorderBased::Border *right, adore::env::BorderBased::Border *left, double z, std::string options, DLR_TS::PlotLab::AFigureStub *figure, bool plotarrows=false) |
| |
| void | plotBorderNavigation (adore::env::BorderBased::Border *right, adore::env::BorderBased::Border *left, double normedCost, DLR_TS::PlotLab::AFigureStub *figure) |
| |
| void | plotBorder (adore::env::BorderBased::Border *right, adore::env::BorderBased::Border *left, DLR_TS::PlotLab::AFigureStub *figure) |
| |
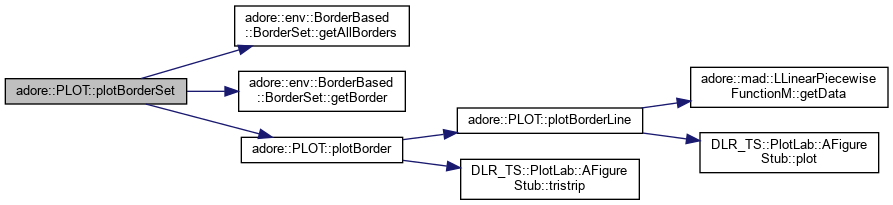
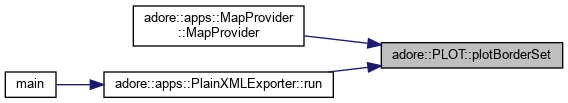
| void | plotBorderSet (adore::env::BorderBased::BorderSet &borderSet, DLR_TS::PlotLab::AFigureStub *figure) |
| |
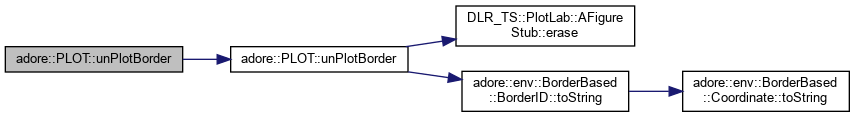
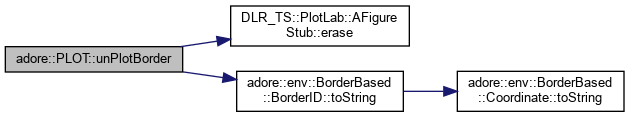
| void | unPlotBorder (adore::env::BorderBased::BorderID rightId, DLR_TS::PlotLab::AFigureStub *figure) |
| |
| void | unPlotBorder (adore::env::BorderBased::Border *right, DLR_TS::PlotLab::AFigureStub *figure) |
| |
| void | unPlotBorder (adore::env::BorderBased::Border *right, adore::env::BorderBased::Border *left, DLR_TS::PlotLab::AFigureStub *figure) |
| |
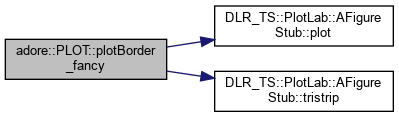
| void | plotBorder_fancy (std::string name, adore::env::BorderBased::Border *right, adore::env::BorderBased::Border *left, double z, bool outlineLeft, bool outlineRight, adore::PLOT::LanePlotConfig config, DLR_TS::PlotLab::AFigureStub *figure) |
| | plots a border object, including left neighbor if !=0 into figure object More...
|
| |
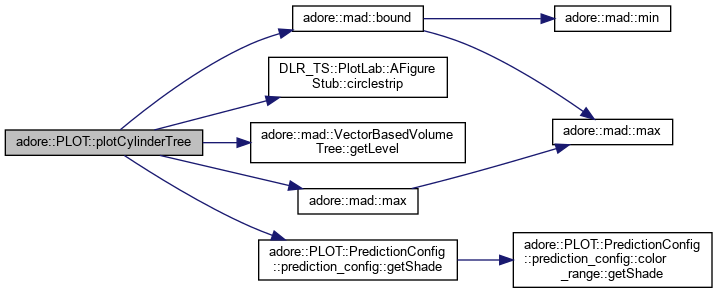
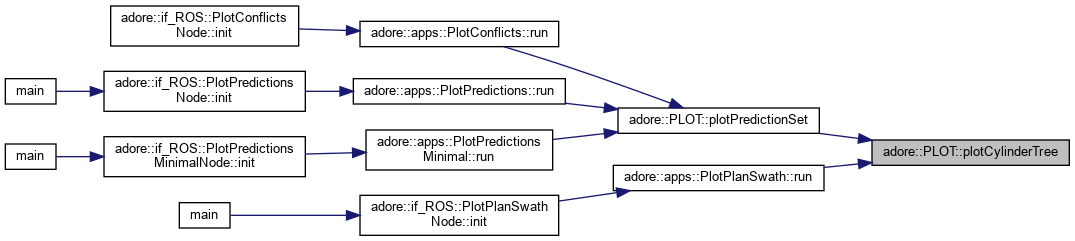
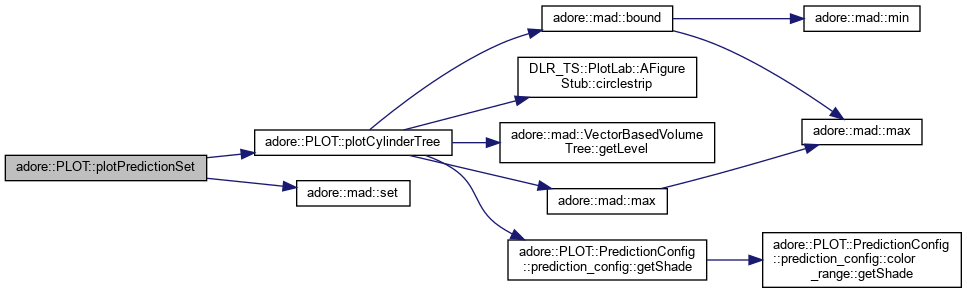
| void | plotCylinderTree (adore::mad::OccupancyCylinderTree tree, double t, double t_max, PLOT::PredictionConfig::prediction_config config, std::string prefix, DLR_TS::PlotLab::AFigureStub *figure, std::unordered_set< std::string > &plot_tags) |
| |
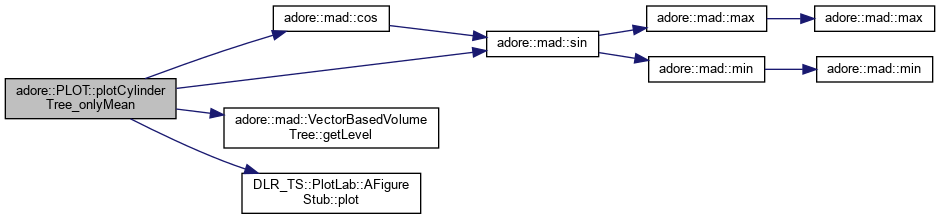
| void | plotCylinderTree_onlyMean (adore::mad::OccupancyCylinderTree tree, double dz, PLOT::PredictionConfig::prediction_config config, std::string prefix, DLR_TS::PlotLab::AFigureStub *figure, std::unordered_set< std::string > &plot_tags) |
| |
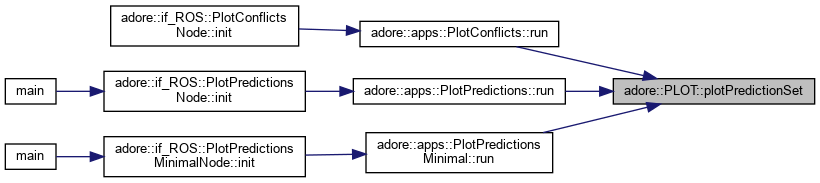
| void | plotPredictionSet (adore::env::OccupancyCylinderPredictionSet set, double t, double t_max, PLOT::PredictionConfig::prediction_config config, std::string subtopic, DLR_TS::PlotLab::AFigureStub *figure, std::unordered_set< std::string > &plot_tags) |
| |
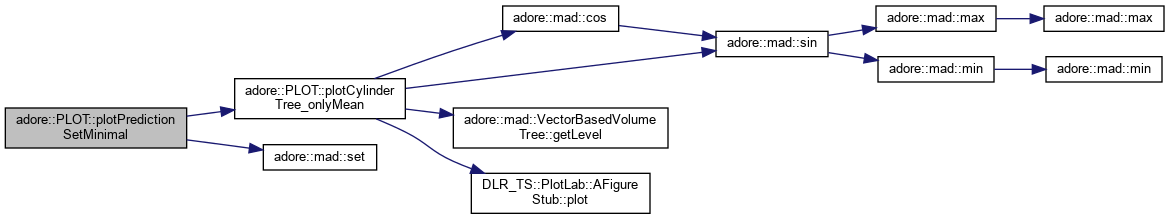
| void | plotPredictionSetMinimal (adore::env::OccupancyCylinderPredictionSet set, double dz, PLOT::PredictionConfig::prediction_config config, std::string subtopic, DLR_TS::PlotLab::AFigureStub *figure, std::unordered_set< std::string > &plot_tags) |
| |
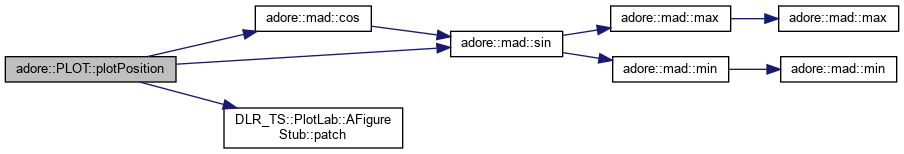
| void | plotPosition (std::string tag, double x, double y, DLR_TS::PlotLab::AFigureStub *figure, std::string options="LineColor=0,0,0;LineWidth=0;FillColor=1,0,0", double r=0.5) |
| |
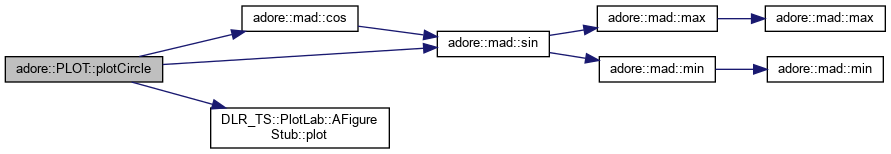
| void | plotCircle (std::string tag, double x, double y, double z, double r, DLR_TS::PlotLab::AFigureStub *figure, std::string options="LineColor=1,0,0;LineWidth=1") |
| |
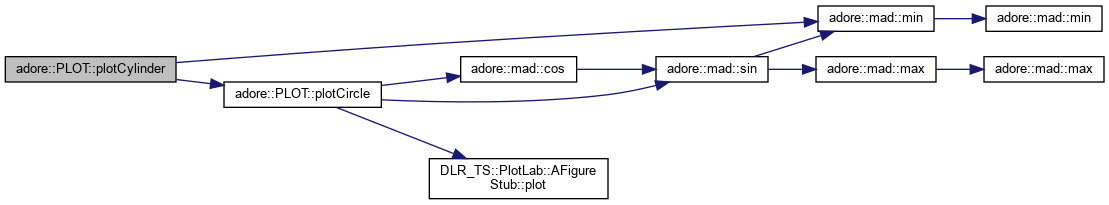
| void | plotCylinder (std::string tag, double x, double y, double z0, double z1, double r, double max_z_diff, DLR_TS::PlotLab::AFigureStub *figure, std::string options="LineColor=1,0,0;LineWidth=1") |
| |
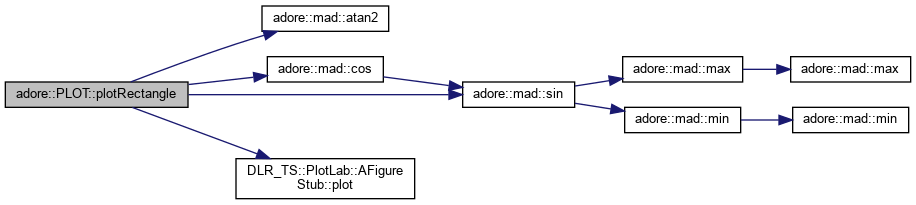
| void | plotRectangle (std::string tag, double x, double y, double l, double w, DLR_TS::PlotLab::AFigureStub *figure, std::string options="LineColor=0,0,0;LineWidth=0;FillColor=1,0,0", double alpha=0.0) |
| |
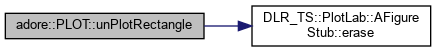
| void | unPlotRectangle (std::string tag, DLR_TS::PlotLab::AFigureStub *figure) |
| |
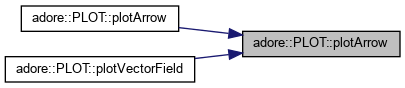
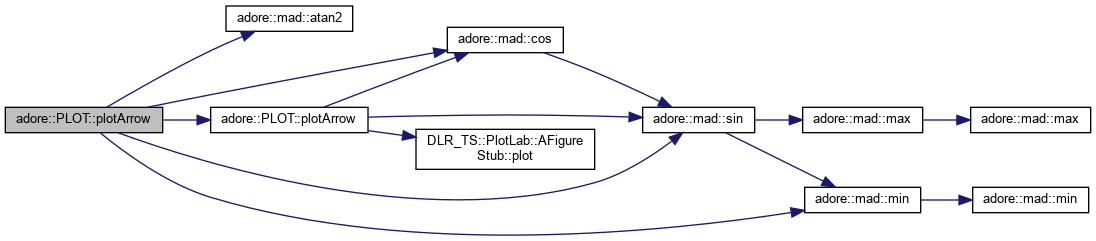
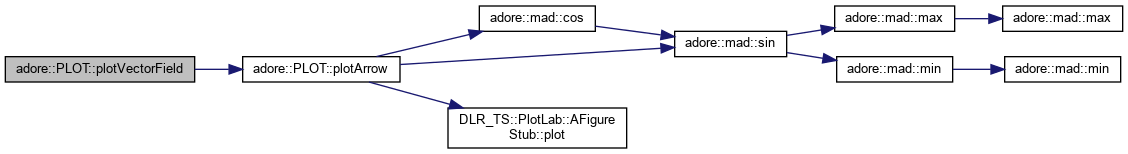
| void | plotArrow (std::string hashtag, double x, double y, double z, double alpha, double shaft_length, double head_length, std::string options, DLR_TS::PlotLab::AFigureStub *figure) |
| |
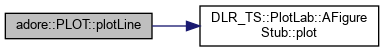
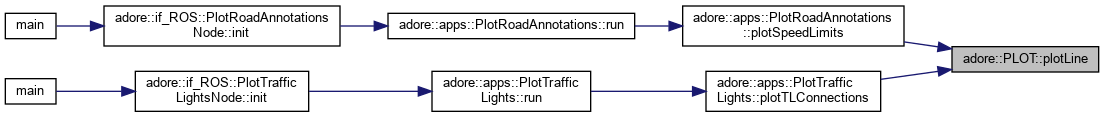
| void | plotLine (std::string hashtag, double x0, double y0, double x1, double y1, double z, std::string options, DLR_TS::PlotLab::AFigureStub *figure) |
| |
| void | plotArrow (std::string hashtag, double x0, double y0, double z0, double x1, double y1, double shaft_length, double head_length, std::string options, DLR_TS::PlotLab::AFigureStub *figure) |
| |
| void | plotVectorField (std::string hashtag, double *X, double *Y, double *dX, double *dY, double z0, int size, std::string options, DLR_TS::PlotLab::AFigureStub *figure) |
| |
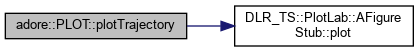
| const void | plotTrajectory (std::string name, const adore::fun::SetPointRequest *const trajectory, std::string options, DLR_TS::PlotLab::AFigureStub *figure, double z=0.0) |
| |
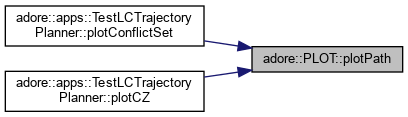
| void | plotPath (std::string name, const adoreMatrix< double > &data, double z, std::string options, DLR_TS::PlotLab::AFigureStub *figure) |
| |
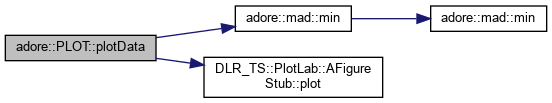
| void | plotData (std::string name, const adoreMatrix< double > &data, double z, int d1, int d2, std::string options, DLR_TS::PlotLab::AFigureStub *figure) |
| |
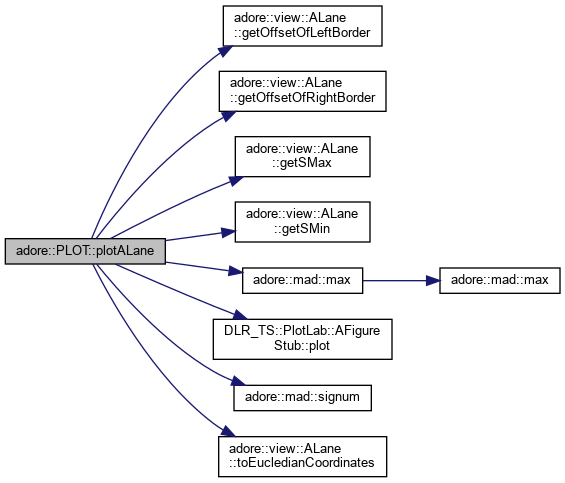
| void | plotALane (adore::view::ALane *alane, std::string tag, adore::PLOT::ViewPlotterConfig config, DLR_TS::PlotLab::AFigureStub *figure, std::string viewtype) |
| |
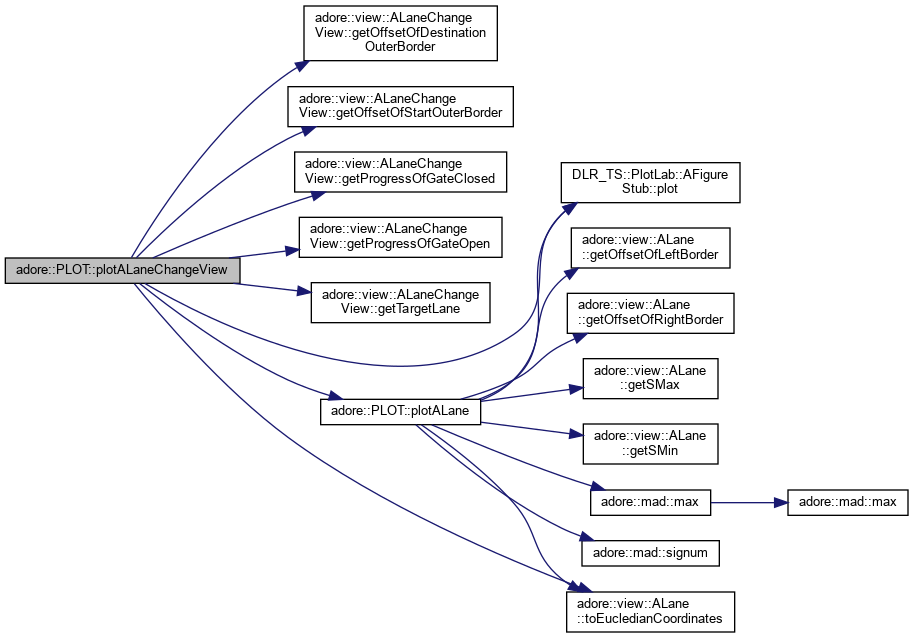
| void | plotALaneChangeView (adore::view::ALaneChangeView *alanechangeview, std::string tag, adore::PLOT::ViewPlotterConfig config, DLR_TS::PlotLab::AFigureStub *figure) |
| |